How to Use Stock Screeners
Your stock screener is one of the most important tools in your arsenal. With thousands of stocks to choose from, it would be extremely overwhelming and hard to search for good stocks to buy all by yourself. Using a screener lets you save a huge amount of time so you can focus on researching only a few companies and analyzing their stocks. If you’re not sure how to use a screener, this post is for you. Keep reading to learn how to use stock screeners to find the best stocks to invest in.
Related Articles
How Does a Stock Screener Work?
Stock screeners allow you to sift through thousands of stocks and quickly find those that meet your requirements. To do this, a screener searches in a database that is provided by stock exchanges (or data providers) and continuously updated. The data points for each stock may be either in real time or with a delay. Once the screening engine finds the stocks that match the parameters set by the user, the screener generates a list.
The parameters that you set are filters to be more specific. Only the stocks that pass all filters will show up in the list. That set of filters is called a ‘screen’.
For example, you can narrow your scope of research to one stock exchange like the NYSE. You can also focus on a specific sector (like technology) and industry (e.g. solar). Or you can choose stocks in the auto parts industry that are priced above $10 and with an average trading volume between 100K and 500K. It’s all up to you! The potential for filter combinations is limitless.
Furthermore, in addition to descriptive filters like the examples above, you can also set filters for technical or fundamental analysis.
The advantages of using a stock screener
Stock screeners have evolved throughout the past two decades to become must-have tools for any trader and investor. Here is why:
Saving time: like we mentioned before, using a screener lets you narrow down your research from thousands of stocks to a small number. The screening process takes only a moment.
Discovery: stock screeners allow you to discover stocks that you may not have found otherwise. Whether you use your own screens or the presets provided by your screener, you will definitely come across stocks you didn’t know about that might be a good match for your investing strategy.
No biases: investors can develop behavioral biases, like favoring a company they like, chasing a trend, or the gambler’s fallacy. As a software tool, a stock screener has zero biases.
Saving screens: you can create and save many screens, each with a different set of filters for a specific strategy. That way, you can come back to your screens at any point in the future and screen for new stocks with the parameters intact.
Automation: most stock screeners have an alert feature that sends you emails whenever a stock passes the filters of one of your screens. In other words, your screener keeps looking for stocks so you don’t have to.
With so many advantages, it makes little sense to not use a screener, especially considering that there are many free screeners available online.
That said, there is one thing you should keep in mind. Just because a stock passes your filters doesn’t mean you have to buy it. You still need to do your research on each of them to determine which ones are truly the right match for your investing strategy and therefore worth buying.
How to Build Your Screen
While there are many stock screeners out there, they mostly work in the same way.
Building your screen consists of choosing a number of filters. But before you do that, you should be clear on your goals. Do you want to find suitable stocks for day trading? Are you more of a swing trader? Or are you looking for long-term investing opportunities? You need to know your investment goals, time horizon, and level of risk tolerance.
Some of the most commonly used filters include:
Price
Volume
Market cap
Sector
P/E
ROE ratio
Dividends
Current ratio
Price above SMA20
Etc.
These filters are just a few examples among many. You don’t have to use them all, but chances are you will select some of them as you build different screens for different strategies.
Just remember that there is a thing such as adding too many filters, in which case your screener might not display any stock. So it’s important to keep an open mind
In addition to building your personalized screens, most screeners have preset screens and sometimes even community screens. These two types of screens are great for learning what other investors are looking for. Plus, you can use them as a base to build your own screens.
To showcase how to use stock screeners, we’re going to provide two examples by using two different screeners.
Example 1: How to Use a Technical Stock Screener
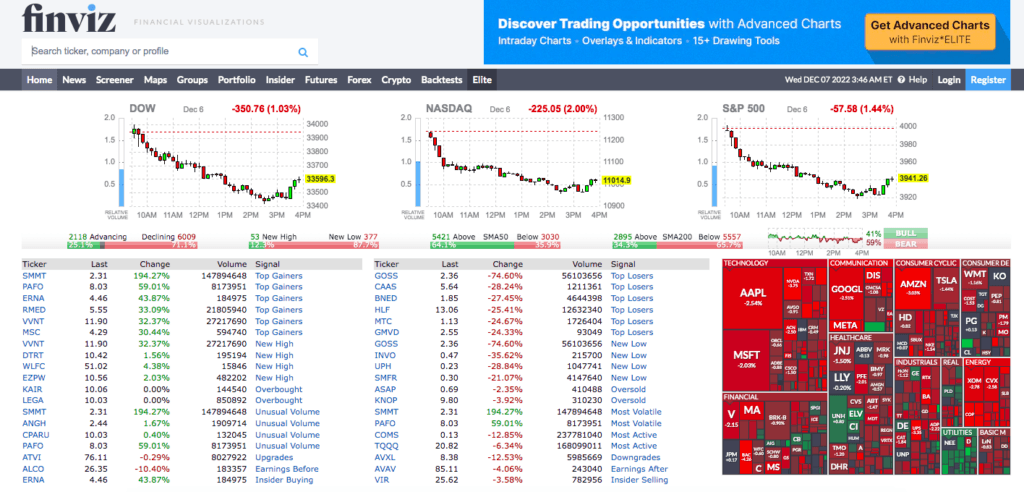
Finviz has been a popular choice among traders and investors since 2007. It’s very easy to use and has an extensive array of filters.
Disclaimer: the content in this blog post is for educational purposes only and should not be construed as professional investment advice.
For this example, let’s say you are looking for stocks to swing trade and have chosen the following criteria:
Market cap: over 300 million
Volume: over 500,000 on average
Price: over $15
20-day SMA: price 10% over SMA20
Go to Finviz and select the Screener tab.
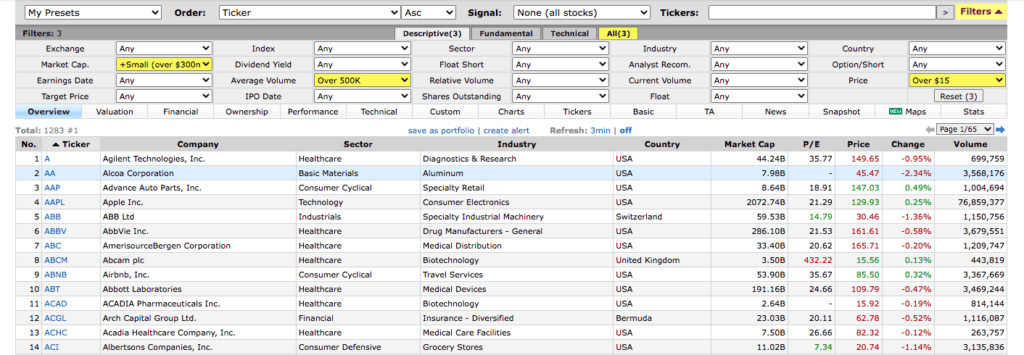
The screening parameters are organized into three main categories: descriptive, technical, and fundamental. The descriptive filters are displayed by default. Select the following filters:
Market cap: +Small (Over 300mln)
Average volume: Over 500K
Price: $15+
After setting these filters, Finviz has found 1283 stocks. That’s better than the whopping 8,400 stocks at the start, but it’s still a lot, so we need to further narrow down our list.
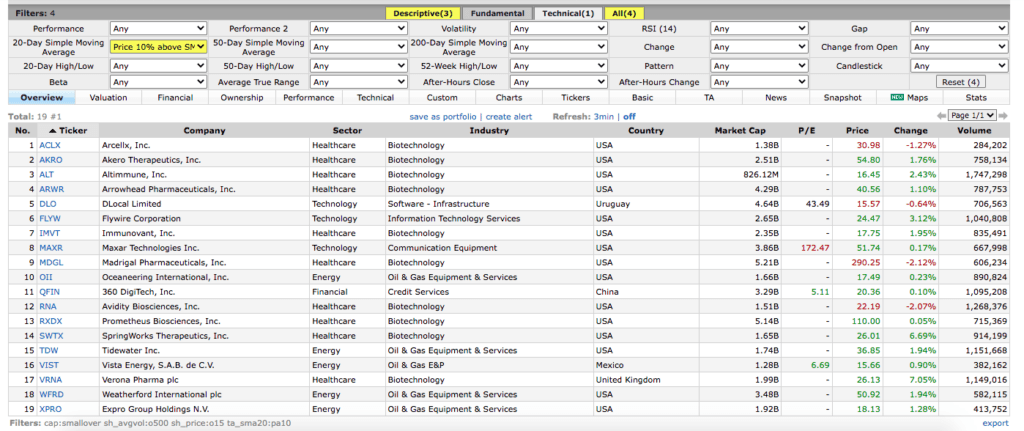
We’re done with descriptive filters. Now, click on the tab ‘Technical’ at the top then select “Price 10% above SMA20” from the 20-Day Simple Moving Average parameter.
Let’s look at the result: only 19 stocks remain after adding the technical filter. Great!
Also, if you don’t know what a filter means, just move your cursor over its name and you’ll see a brief description of what it means. And keep in mind that results for the same filters will always change since data is continuously updated.
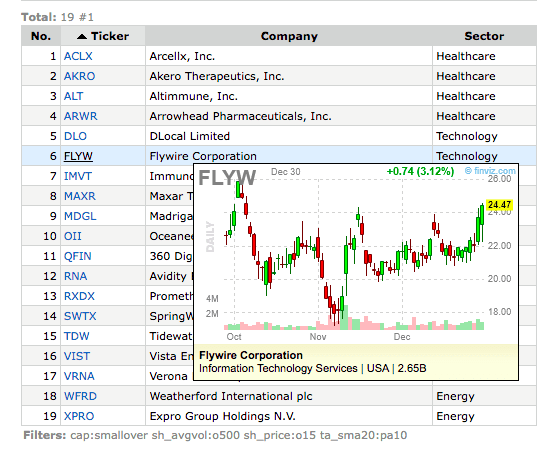
From here, hover your cursor over a stock’s name and you will see a small chart of that stock.
Whenever Finviz generates a list of stocks, the tab “Overview” is selected by default. You can see more details on those stocks by clicking on the other tabs, like “Valuation”, “Performance”, “Technical”, etc.
You can click on the tab “Charts” to display larger charts for all the stocks in the list.
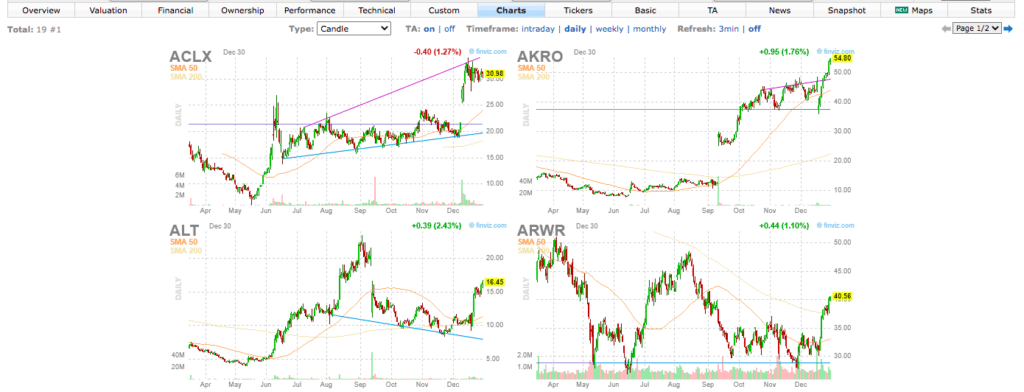
If you click on one of these charts (or the stock’s symbol on the list), Finviz will open a page specific to that stock where you can see a more detailed chart along with a lot of other information: technical indicators, news, etc.
Check the support and resistance levels then try to see if there is a pattern that could indicate an upcoming opportunity. Additionally, you can research the overall market sentiment to get a feel for how the price might move.
So as you can see, Finviz is quite simple to use and has a powerful screening engine. You can start using Finviz for free and create up to 50 screen presets. But if you upgrade to Finviz*Elite, you will unlock many advanced features such as real-time quotes, intraday charts, fundamental charts, backtesting, and email alerts among others.
Disclaimer: This blog post includes affiliate links. We may receive compensation for clicks that result in a purchase, at no extra cost to you.
Example 2: How to Use a Fundamental Stock Screener
WallStreetZen is a stock screener built specifically for fundamental analysts. You have a large range of filters to choose from, including descriptive and technical filters. But where WallStreetZen really stands out is the array of fundamental indicators, from valuation to forecasts and dividends to mention a few.
In addition to its screening abilities, WallStreetZen also gives you a detailed overview of any stock, with information on key metrics, financials, forecast, and more, thus saving you a lot of time that you would spend scrutinizing websites and reports.
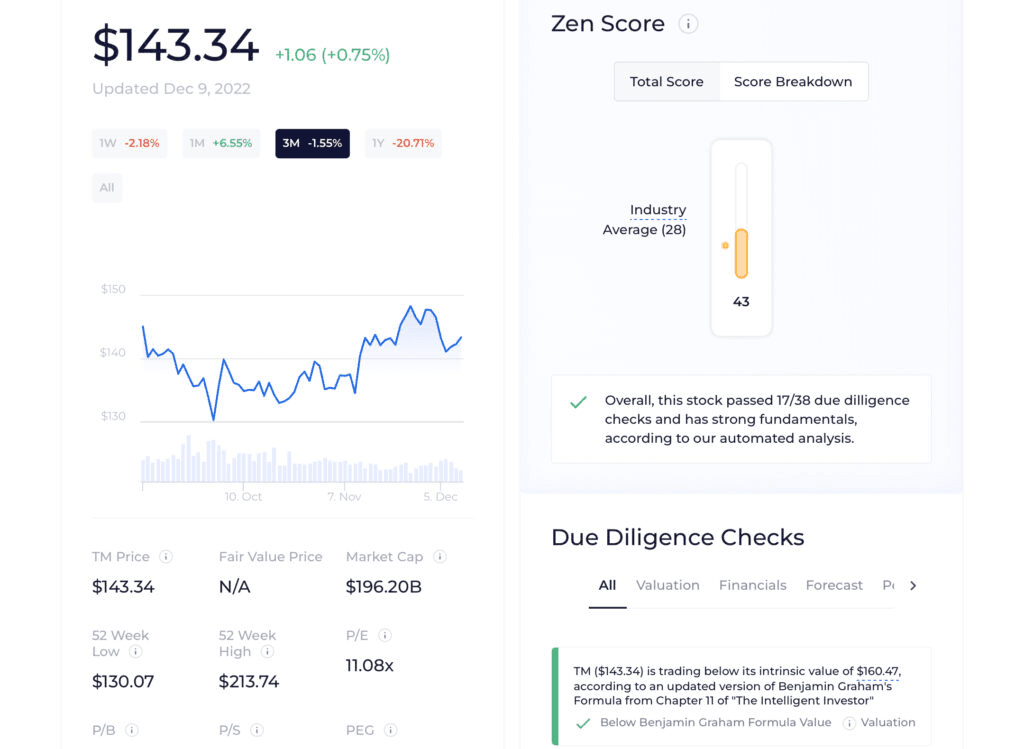
The most unique feature of WallStreetZen is the Zen Score, a score calculated by running a number of due diligence checks across five dimensions: valuation, forecast, performance, financials, and dividends. For each dimension, you can see which checks the stock passed and which it didn’t. So the higher a stock’s score is, the more likely it is to perform better in the future. You even get the average industry score so you can compare a company’s performance with that of the industry. Overall, the Zen Score saves you hours of research by doing it for you.
Another handy feature to use is Stock Ideas, which gives you stock recommendations based on different screening setups, like “Strong Buys from Top Wall Street Analysts”, “Undervalued Stocks”, or “Buy the Dip”. That’s pretty convenient if you’re not sure what kind of stock to look for, or if you want to explore different investing strategies.
How to use WallStreetZen to find stocks
So for this example, suppose you’re looking for a company in the tech sector that is performing well despite the ongoing recession.
First, go to the website’s homepage and click on “Screener” from the top menu.
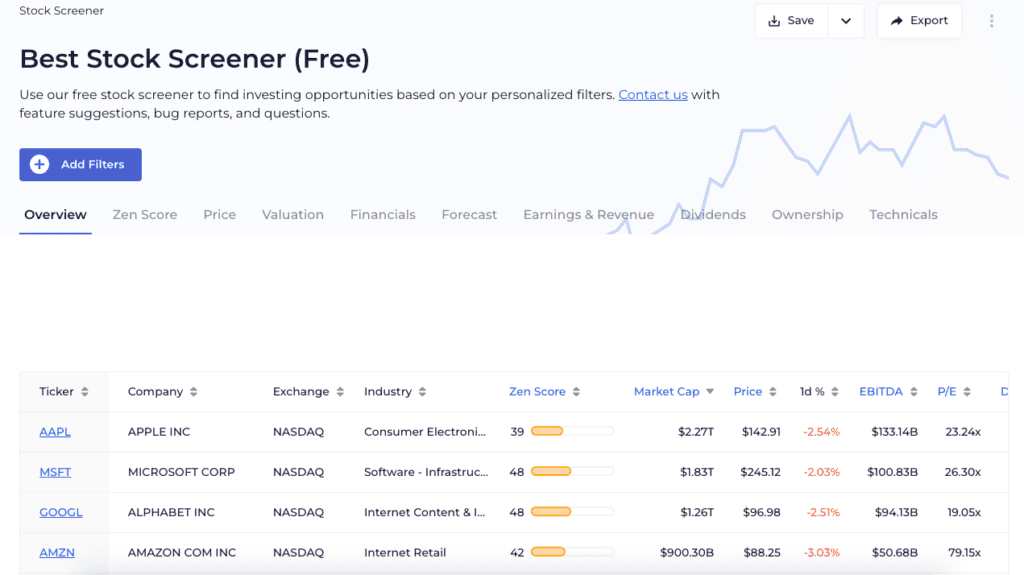
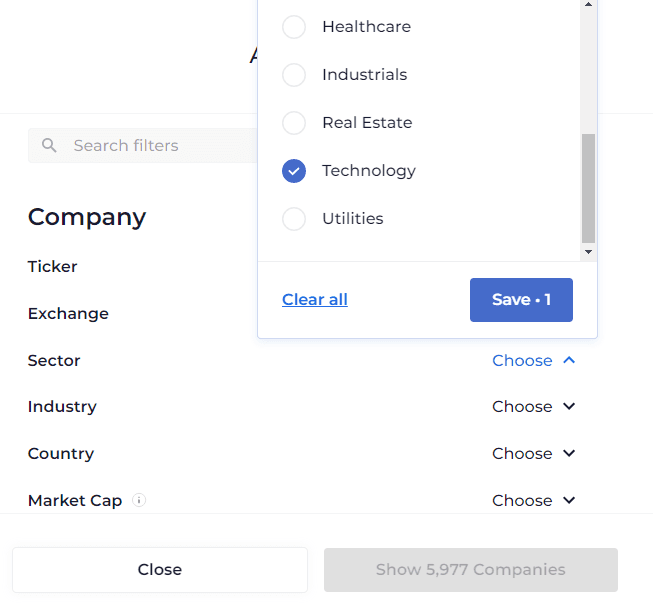
Click on the blue button “+ Add Filters” to start building your screen. You’ll see a number of filters; under the Company section, click on “Choose” which is located to the right of the “Sector” filter. Select “Technology” and click on “Save”. The number of companies will drop to 995.
Next, scroll down to the section “Zen Score: Valuation Checks”. Go to the filter “PEG Value” and choose “Pass”. WallStreetZen will then only keep stocks with a PEG ratio within the acceptable range of 0-1. As seen in this screenshot, there are 138 companies in the tech sector that pass this filter.
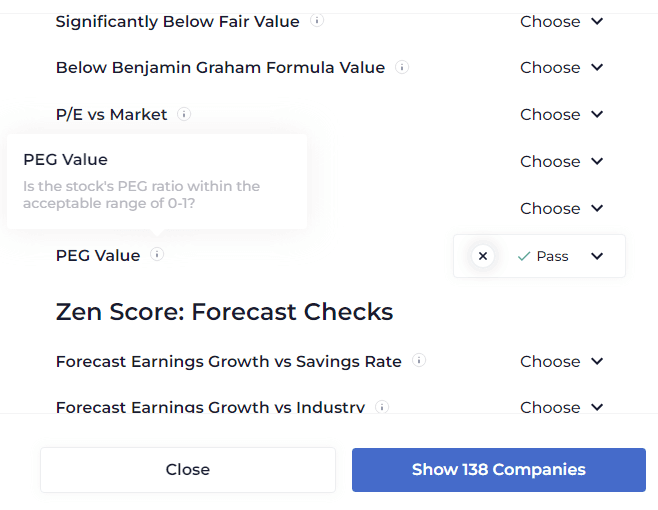
Pro tip: If you don’t know what a filter means, there is a small “i” icon you can click on to read a short description.
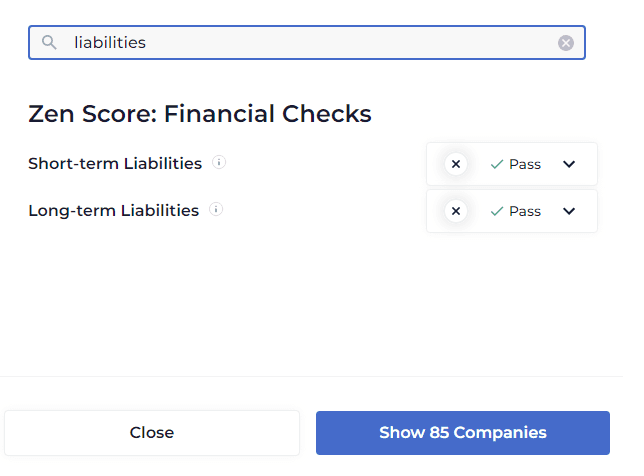
Alright, so now we suggest you add a filter for the liability aspects. The idea here is that we don’t want to invest in companies with liabilities that are greater than their assets. So return to the top of the filters list, and type “liabilities” in the search bar. The search result will show you two filters, one for short-term liabilities and one for long-term liabilities. Choose “Pass” in both; the total number of companies is now 85.
To further narrow down our list of companies, we’re going to add filters for forecasts.
Type “forecast” in the search bar. In the Forecast Score filter, click on “Choose” and type a value of 50 in the Minimum Score bar.
After that, locate the filter “Forecast Earnings Growth vs Market”. This filter screens for companies with an annual growth rate in earnings that is forecasted to be above the market average over the next 3 years. Choose “Pass” to add this filter. Only 18 companies remain!
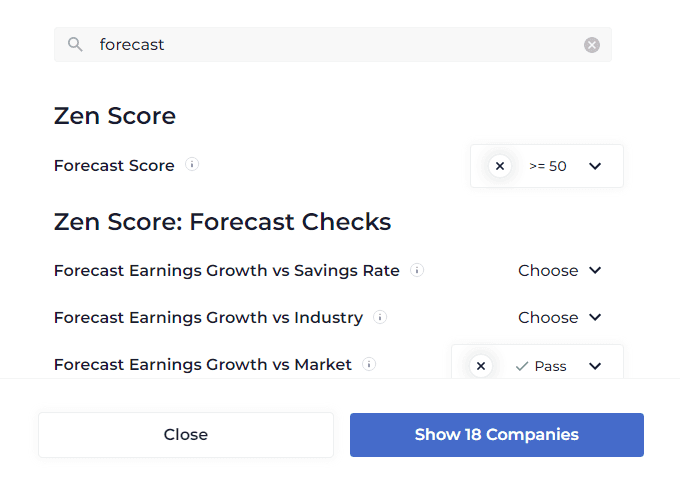
We’re done with adding filters, so click on “Show 18 Companies”. Let’s see the results:
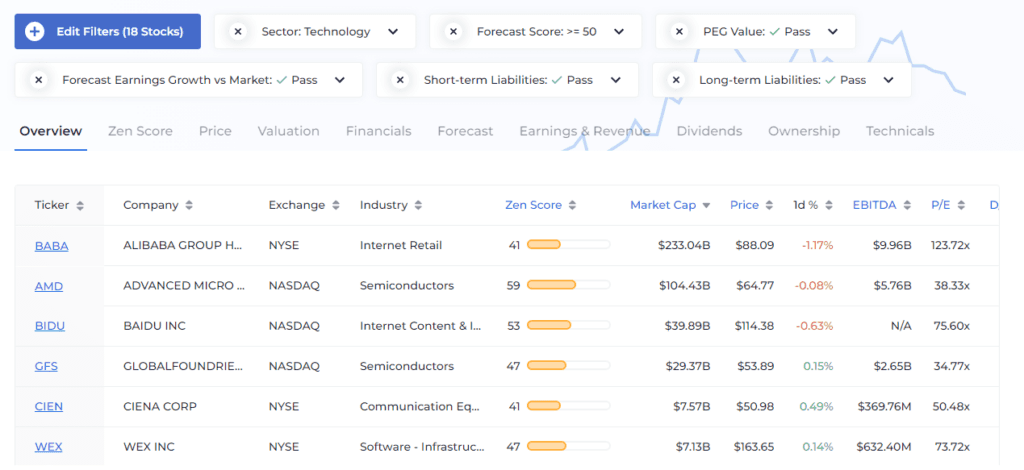
That was pretty easy, wasn’t it? You can add more filters if you want to further narrow down your research.
You can also save your screens as well as put any stock you want on a watchlist. And in case you want to delete a filter you added, just click on the “X” next to that filter.
While WallStreetZen is easy to use and rich in parameters, this is not its full power. Upgrading to WallStreetZen Premium gives you unlimited access to Zen Scores, Strong Buy picks, forecasts from top analysts, the feature “Why Price Moved” which explains why a stock is trading higher or lower, and more.
Disclaimer: This blog post includes affiliate links. We may receive compensation for clicks that result in a purchase, at no extra cost to you.
Now you know how to use two different stock screeners. But it’s not time to buy yet! Here is our last piece of advice: you must always do your research thoroughly before investing in a company—particularly in the case of long-term investments.
Always Do Your Research
After selecting your parameters, your screener will produce a list of stocks. So let’s say you have found some interesting stocks. But before you enter a position, you should research the company to understand its business model and gauge its growth potential.
The reason for this is that screeners search for stocks based on descriptive parameters (exchange, sector, market cap, IPO date, etc.) and quantitative parameters (technical and fundamental). As such, they can’t take into consideration qualitative factors like the performance of competitors, customer satisfaction, brand image, intangible assets, or management decisions. So the list produced by your screener is not a buy list, but simply a list of stocks that match the criteria you chose.
So don’t forget to research those qualitative factors and assess their potential impact (either positive or negative) on the stocks you’re considering. Trading tools are super useful, but the final say should be left to human judgment.
How to Use Stock Screeners: In Conclusion
Stock screeners are essential for narrowing down thousands of stocks to a few that show potential. From there, take the time to do some technical or fundamental analysis (or both). Not every stock that passes your filters is necessarily worth buying. Likewise, there will be times when you will find a lot of good choices! Make sure to research the companies beforehand and you make your choice wisely. Your goals, time horizon, risk tolerance will nudge you in the right direction.
Choosing the right stocks to invest in is just the beginning. After you buy securities, you want to keep track of your trading activity and results. If you haven’t used Tradervue already, you can try it for free. Tradervue lets you import all your trades in seconds and analyze them right away with plenty of charts and graphs. You can make daily notes, tag and sort trades, share them with other traders, and so much more.
Author:

Patricia Buczko
Category:
User Stories


