
How to Trade Bullish Pennant Patterns for Maximum Profit

What is a Bullish Pennant Pattern?
A bullish pennant pattern resembles a flag pole with a small symmetrical triangle at the top.
It begins with a large initial movement, followed by a sharp upward price movement in a brief consolidation period (the pennant).
This consolidation phase forms a triangular shape, indicating a temporary pause in the upward trend. After this brief pause, the price often breaks out, continuing the uptrend.
These patterns have been part of technical analysis tools since the late 1800s, with early market theorists recognizing their significance.
Bullish pennant chart patterns appear in various financial markets, including stocks, the forex market, commodities, and cryptocurrencies, making them versatile for traders across different asset classes.
Anatomy of the Bullish Pennant Pattern
A bull pennant pattern consists of three main components:
The flag pole is the strong move upward, characterized by a steep, often near-vertical price rise.
The pennant formation is a period of consolidation during which the price consolidates in a small symmetrical triangle. During this phase, the price movement narrows, forming higher lows and lower highs.
The breakout point occurs when the price breaks above the pennant's upper trendline, signaling the continuation of the uptrend.
The entire pattern typically forms over several weeks, but its duration can vary based on market conditions.
Traders might observe pennants forming over hours on intraday charts, while longer-term investors might see them develop over months on a price chart.
The Psychology Behind Bullish Pennants
Bullish pennants reflect the underlying psychology of market participants. Here's how the pattern typically unfolds:
Initial surge (flag pole): Strong buying pressure drives a large increase in price rapidly. This could be due to positive news or other bullish factors.
Consolidation (pennant): As the price reaches new resistance levels, some traders begin to take profit, leading to a brief pause in the uptrend. Meanwhile, new buyers are cautiously entering the market, creating a balance between supply and demand.
Breakout: When new buyers outnumber profit-takers, the price breaks out of the pennant. This often attracts more buyers, further driving up the price.
This pattern is like a contest between cautious bulls and hopeful bears, with the bulls typically winning in the end.
The pennant represents a brief consolidation before the market continues its upward trajectory.
Spotting a Bullish Pennant

Identifying a bullish pennant pattern requires attention to detail. Here's a step-by-step guide:
Look for a strong uptrend with a steep price climb (the flag pole): This should be a clear, strong move upward over a relatively short period.
Watch for a sideways move forming higher lows and lower highs: This is the beginning of the pennant formation.
Check if it forms a small symmetrical triangle: The price should consolidate into an increasingly narrow range.
Confirm that the consolidation is shorter than the flag pole: Typically, the pennant should not last longer than 3-4 weeks.
Wait for the price to break above the pennant's upper trendline: This signals that the pattern is complete and that the uptrend is likely to continue.
Don’t Confuse Pennants with Similar Patterns:
Flag patterns: These have parallel lines during consolidation, unlike the converging trend lines of a pennant.
Wedge patterns: These are larger and slope against the prevailing trend, while pennants are smaller and neutral.
Volume’s Role in Bullish Pennants
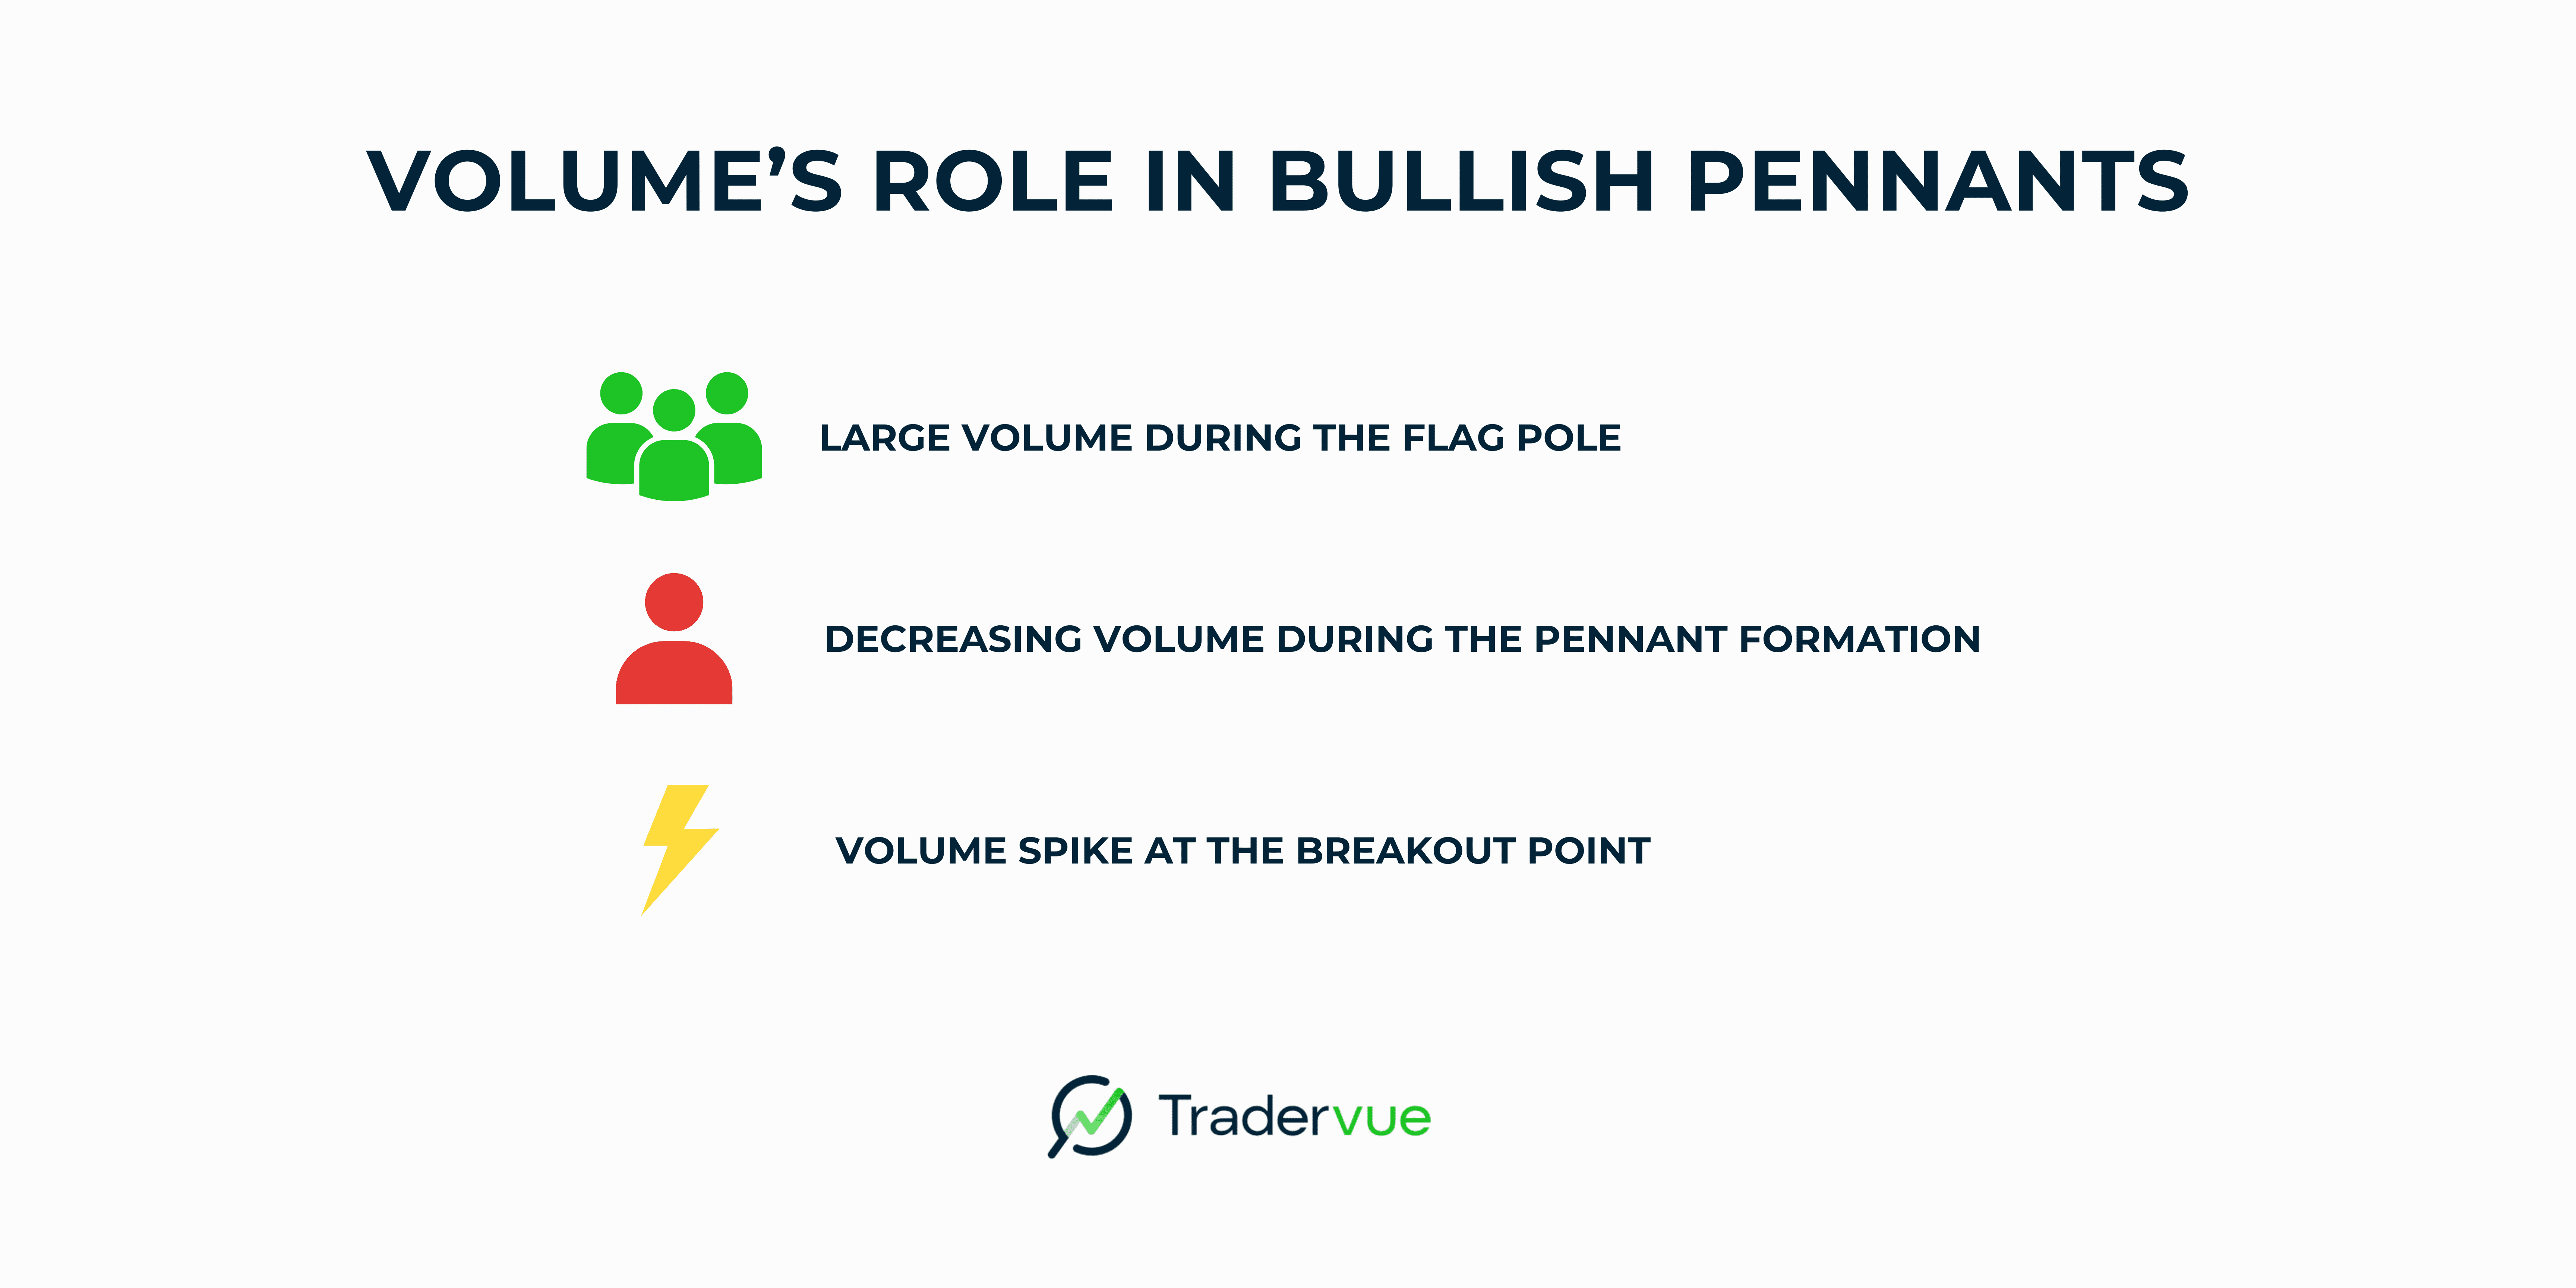
Trading volume is crucial in confirming the validity of a bullish pennant pattern. Here's what to look for:
Large volume during the flag pole: This confirms strong buying interest during the initial price surge.
Decreasing volume during the pennant formation: As the price consolidates, volume should taper off, indicating a temporary equilibrium between buyers and sellers.
Volume spike at the breakout point: When the price breaks out of the pennant, volume should increase significantly, confirming renewed buying pressure.
This volume pattern supports the pennant's strength as a continuation signal. If the volume doesn't align with these expectations, the pattern may be less reliable.
Confirming Your Bullish Pennant
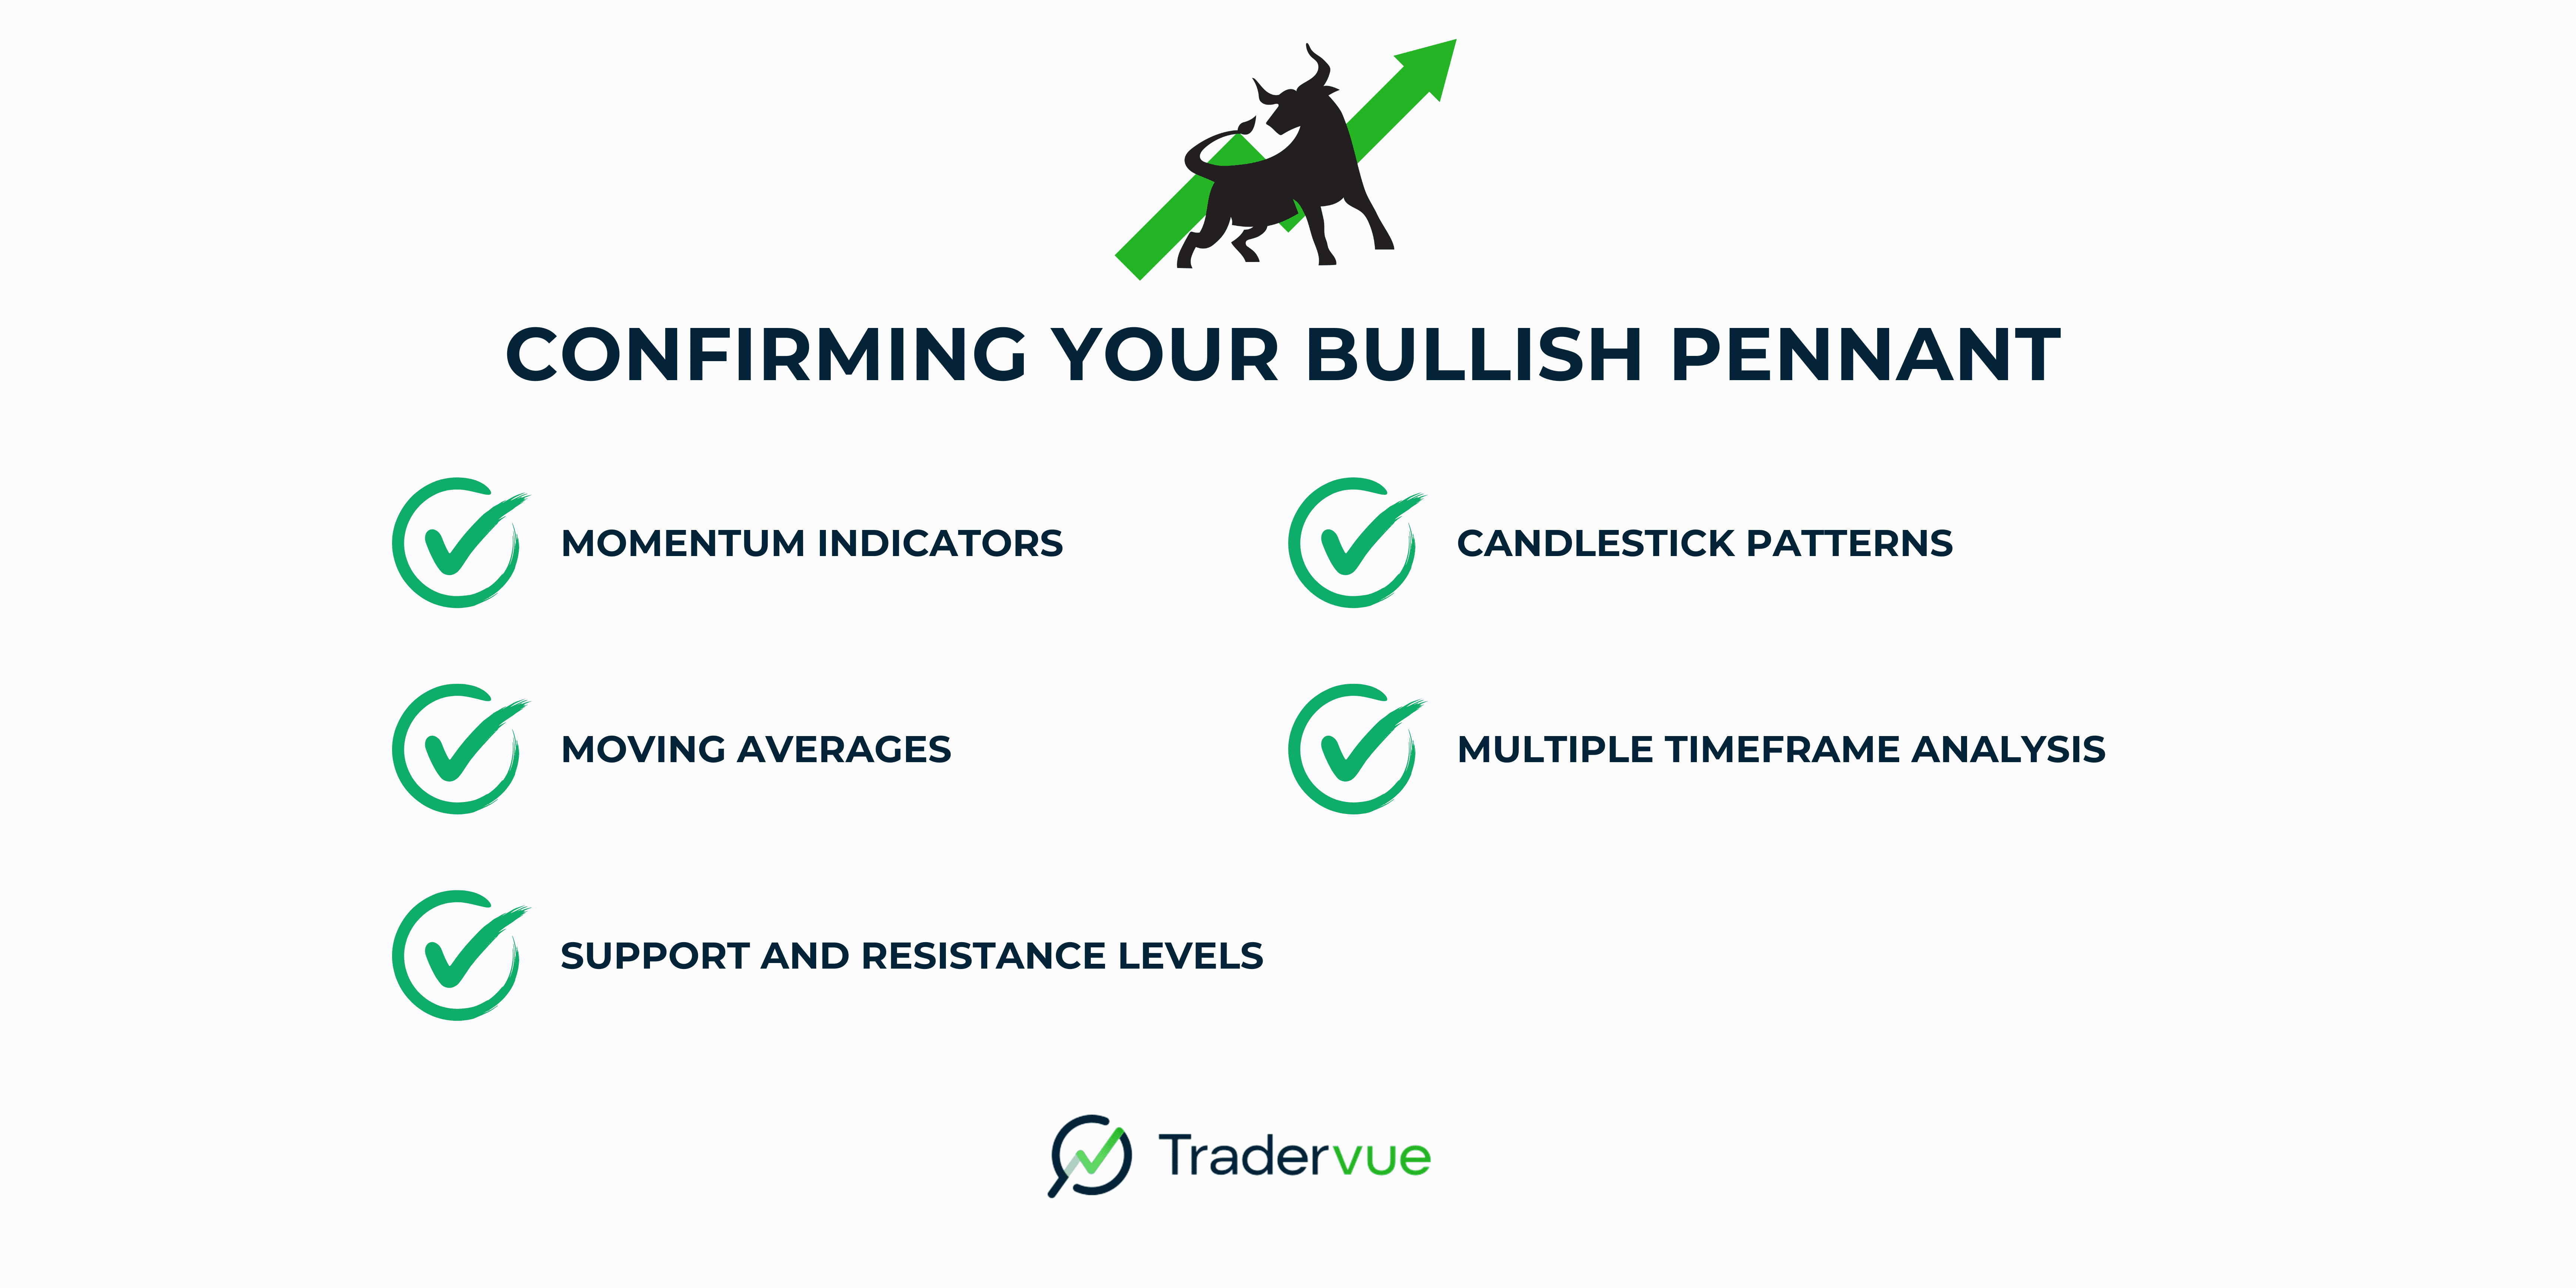
To increase confidence in your trading decisions, use additional technical indicators:
Momentum indicators: To confirm the underlying trend strength, use tools like the Relative Strength Index (RSI) or Moving Average Convergence Divergence (MACD).
Moving averages: Check if the price is above key moving averages, indicating an overall upward trend.
Support and resistance levels: Look for the pennant forming near significant support levels, which can provide additional confirmation.
Candlestick patterns: Watch for bullish candlestick patterns at the breakout level, such as bullish engulfing patterns or hammer candles.
Multiple timeframe analysis: Ensure the pattern aligns with trends on both higher and lower timeframes for stronger confirmation.
Trading Strategies for Bullish Pennants

When you spot a bullish pennant pattern, you have several potential trading strategies:
Conservative approach:
Entry point: Wait for a confirmed breakout above the upper trendline of the pennant.
Stop-loss order: Place just below the lower trendline of the pennant.
Profit target: Measure the height of the flagpole and project that distance from the breakout price.
Aggressive approach:
Entry: Enter near the apex of the pennant, anticipating the bullish breakout.
Stop loss level: Place just below the lower trendline of the pennant.
Take profit: Same as the conservative approach.
Breakout retest strategy:
Entry: Wait for the breakout, then enter when the price pulls back to test the broken resistance line as support.
Stop-loss: Place just below the retest point.
Price target: Use the flagpole measurement or set multiple exit points using Fibonacci extensions.
Remember, never risk more than 1-2% of your trading capital on a single trade. Always use proper risk management techniques to protect your trading account from significant risk.
Advanced Bullish Pennant Concepts

As you become more familiar with bullish pennants, consider these advanced concepts:
Pennants in different market conditions: In highly volatile markets, pennants might form more quickly and be less symmetrical. In calm markets, they may take longer to develop.
Pennants across asset classes: While the basic structure remains the same, pennants may have slight variations in appearance or reliability across stocks, forex, commodities, and cryptocurrencies.
Combining with other patterns: A bullish pennant forming after a cup and handle pattern or at the end of a larger consolidation can be particularly powerful.
Failed pennants: Sometimes, the price may break down instead of up. These failed patterns can provide short-position opportunities for nimble traders.
Pennants in an overall market context: For a more comprehensive analysis, consider how the pennant fits into larger market trends and cycles.
Common Pitfalls and How to Avoid Them
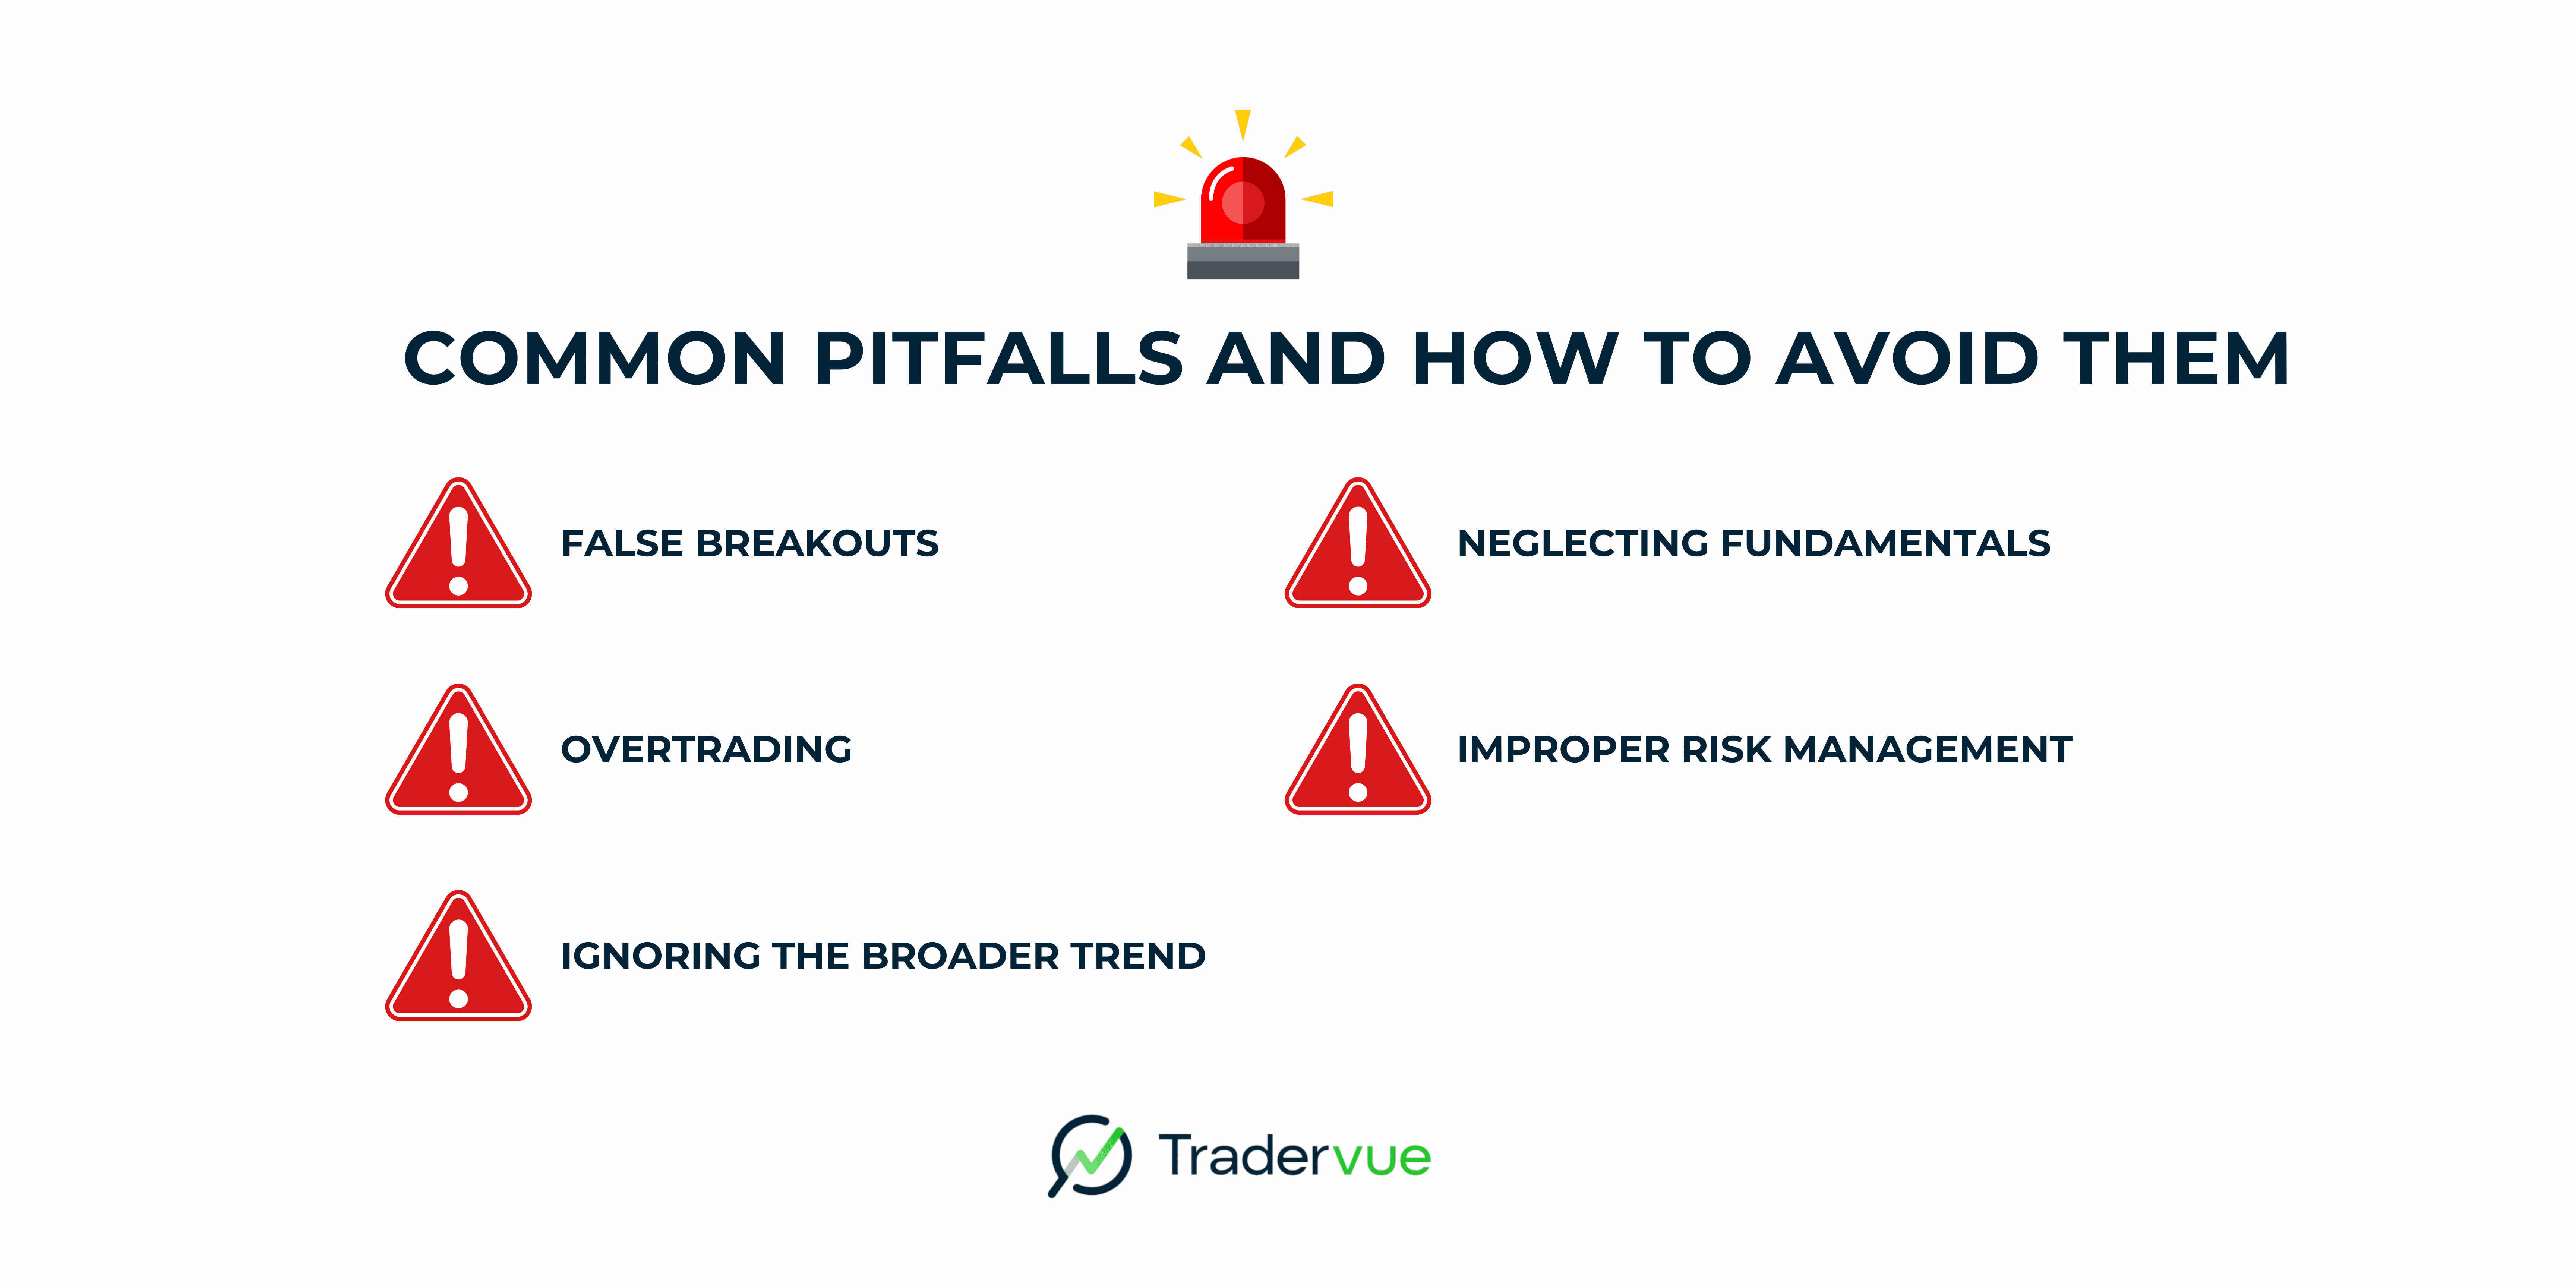
Be aware of these common traps when trading bullish pennants:
False breakouts: Sometimes, the price may briefly break above the pennant before reversing. To avoid this false signal:
Wait for a convincing close above the resistance level
Ensure large volume accompanies the breakout
Use a time filter (e.g$., wait for a 1-hour close above the trendline)
Overtrading: Don't force trades on every pennant you see. Ensure each trade aligns with your overall strategy and risk tolerance.
Ignoring the broader trend: Be cautious of pennants forming against the previous trend, as they may be less reliable.
Neglecting fundamentals: While pennants are technical patterns, important external factors that could impact price movement should not be ignored.
Improper risk management: Always use stop-losses and adhere to your predetermined risk parameters.
Bullish vs. Bearish Pennants: Key Differences

While this guide focuses on bullish pennants, it's important to understand their bearish counterparts:
Trend direction: Bullish pennants follow uptrends, while bearish pennant patterns follow downtrends.
Breakout direction: Bullish pennants break upward, and bearish pennants break in the opposite direction.
Volume characteristics: Similar for both, but reversed for bearish pennants (high volume on downward moves).
Trading approach: For bearish pennants, traders look to short the asset or exit long positions.
Market psychology: Bearish pennants represent a pause in selling pressure before further declines, opposite to bullish pennants.
Understanding both types of pennants can provide a more complete picture of market dynamics and potential opportunities.
Pennants in Different Time Frames

Bullish pennants can form on various time frames, from 5-minute charts to weekly or even monthly charts.
Here's how they differ:
Short-term pennants (intraday to daily charts):
Form more frequently
Require quicker decision-making
May be more prone to false breakouts
Suitable for day traders and swing traders
Long-term pennants (weekly to monthly charts):
Form less often but may be more reliable
Provide more time for analysis and decision-making
Often represent more significant trend continuations
Suitable for position traders and investors
When analyzing pennants, it's often helpful to check multiple time frames for confirmation and to gain a more comprehensive view of the market structure.
Beyond Basic Trading: Alternative Uses for Bullish Pennants
Pennants aren't just for determining entry and exit points. Here are some alternative uses:
Market timing: Use pennants to time entries into long positions, even if you're not trading the pattern directly.
Sector analysis: Identify sectors showing multiple bullish pennants to spot potential industry-wide trends.
Risk assessment: Use the formation of pennants to gauge overall market sentiment and adjust your risk exposure accordingly.
Portfolio management: Rotate into stocks or assets, forming bullish pennants for potential outperformance.
Options strategies: Use pennants to time the entry of bullish options strategies, such as call purchases or bull call spreads.
Technology and Bullish Pennants
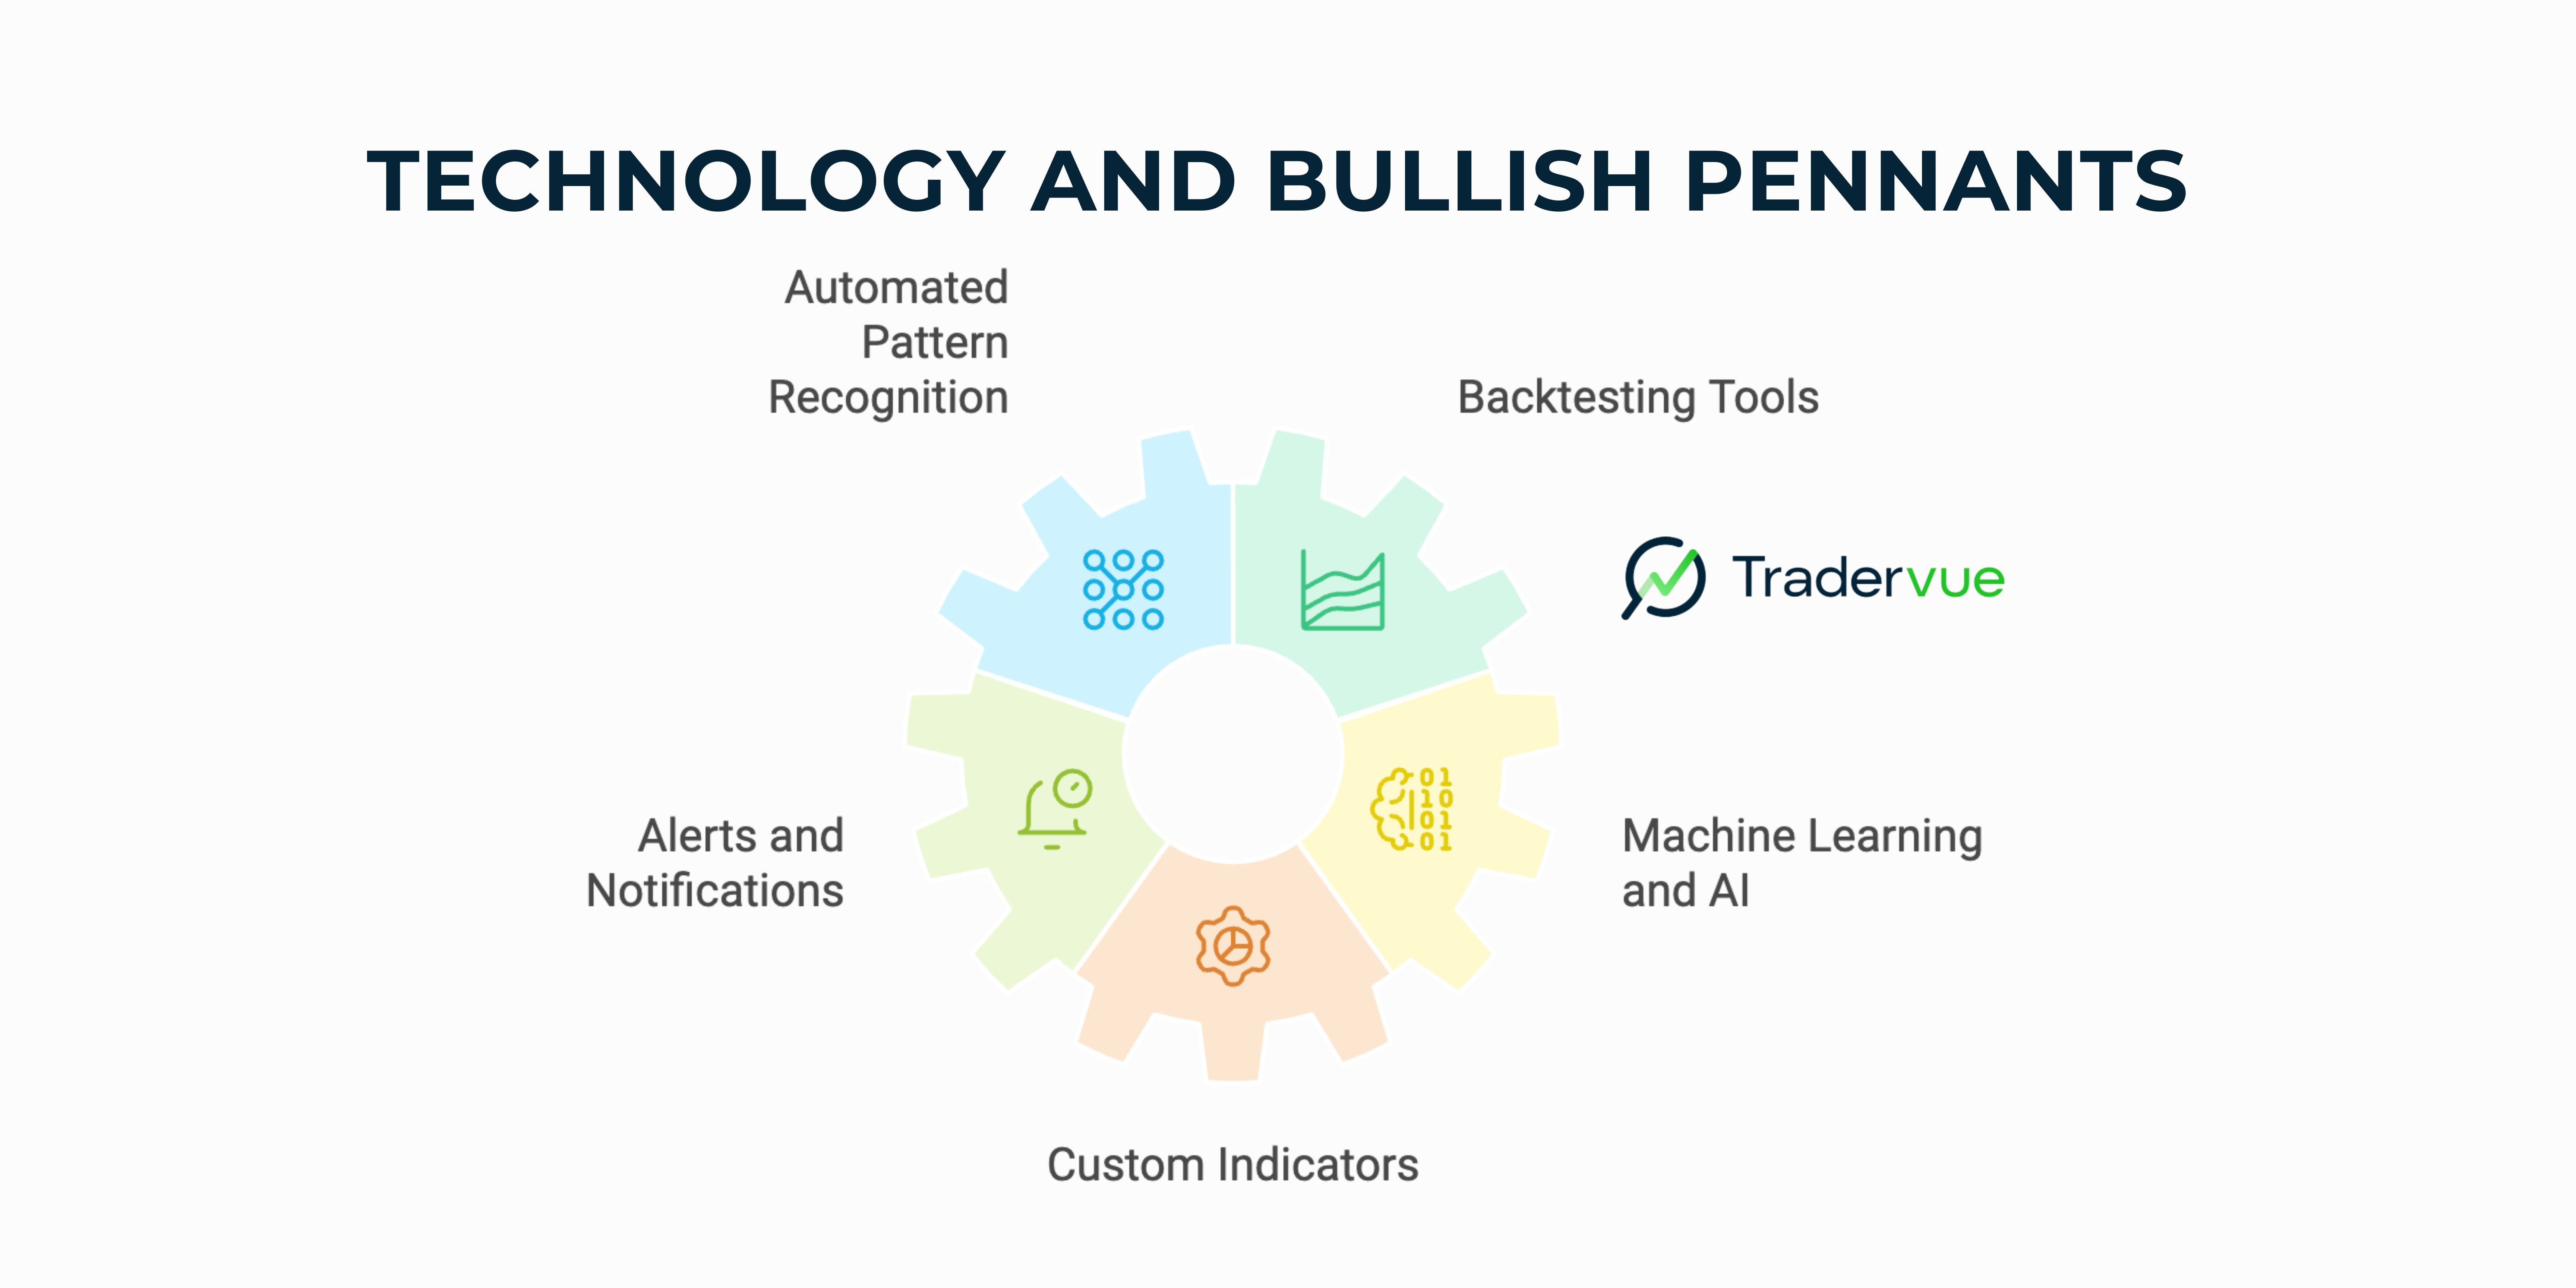
Modern trading platforms and software have made identifying and analyzing bullish pennants easier than ever:
Automated pattern recognition: Many charting platforms now offer automated pennant detection. However, always verify these signals manually.
Backtesting tools: Use historical data to test the performance of pennant-based strategies across different markets and time periods.
Alerts and notifications: Set up alerts for potential pennant formations or breakouts to stay on top of opportunities.
Machine learning and AI: Some advanced systems use artificial intelligence to identify and analyze chart patterns, including pennants. While promising, these should be used in conjunction with human analysis.
Custom indicators: Develop or use custom indicators that help identify pennant characteristics, such as converging trendlines or volume patterns.
Conclusion: Mastering Bullish Pennant Patterns
Bullish pennant patterns are powerful technical analysis tools, but they're not infallible.
Use them as part of a comprehensive trading strategy that includes:
Thorough market analysis
Proper risk management
Consideration of fundamental factors
Continuous learning and adaptation
As you gain experience, you'll develop a better feel for identifying and trading these patterns. Remember, successful trading is as much about managing risk and emotions as it is about finding the right patterns.
Keep practicing, stay disciplined, and always be prepared to adapt your strategies as market conditions change.
With time and experience, bullish pennants can become a valuable addition to your trading toolkit, helping you identify potential opportunities in various financial markets.
Author:

Patricia Buczko
Category:
User Stories


